2454_2026-09-03_2030EPS試算
聯發科資料中心 ASIC 與 2030 EPS 情境試算
✍️ Abstract
- 產品代際接力:聯發科 深度切入 Google TPU 供應鏈,由 TPU v8 (2027E 達 410 萬顆高峰)、TPU v9 與 TPU v10 接力放量,帶動資料中心 ASIC 營收從 2026E 的 22.5 億美元高速成長至 2030E 的 885.5 億美元。
- 獲利情境試算:在 TPU 毛利率維持 36%~42% 假設下,預估 2026E EPS 為 70 元、2027E 翻倍至 155 元、2028E 達 318 元,2030E 在 TPU v10 放量下更可達 749 元。
- 數據限制與風險:J.P. Morgan 特別註記 2029~2030 年數據為 TPU v10 之情境試算 (非官方正式預測),實際獲利高度取決於 Google 晶片架構迭代時程、良率及雲端資本支出強度。
☘️ Article
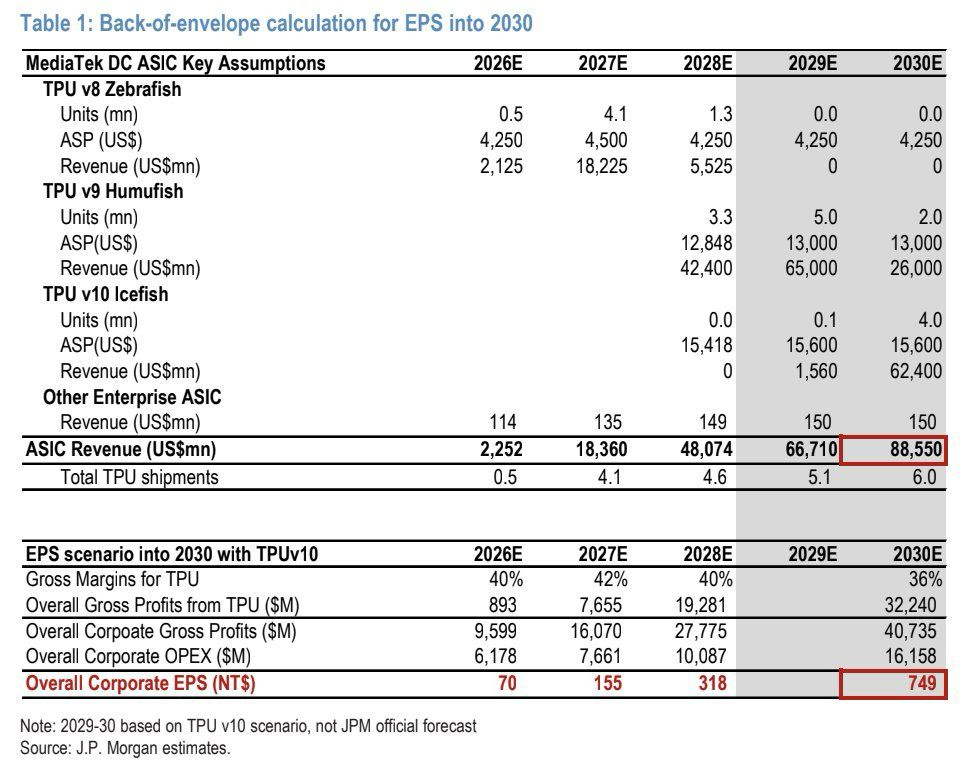
Table 1: Back-of-envelope calculation for EPS into 2030
| MediaTek DC ASIC Key Assumptions | 2026E | 2027E | 2028E | 2029E | 2030E |
|---|---|---|---|---|---|
| TPU v8 Zebrafish | x | x | x | x | x |
| Units (mn) | 0.5 | 4.1 | 1.3 | 0.0 | 0.0 |
| ASP (US$) | 4,250 | 4,500 | 4,250 | 4,250 | 4,250 |
| Revenue (US$mn) | 2,125 | 18,225 | 5,525 | 0 | 0 |
| TPU v9 Humufish | x | x | x | x | x |
| Units (mn) | x | x | 3.3 | 5.0 | 2.0 |
| ASP(US$) | x | x | 12,848 | 13,000 | 13,000 |
| Revenue (US$mn) | x | x | 42,400 | 65,000 | 26,000 |
| TPU v10 Icefish | x | x | x | x | x |
| Units (mn) | x | x | 0.0 | 0.1 | 4.0 |
| ASP(US$) | x | x | 15,418 | 15,600 | 15,600 |
| Revenue (US$mn) | x | x | 0 | 1,560 | 62,400 |
| Other Enterprise ASIC | x | x | x | x | x |
| Revenue (US$mn) | 114 | 135 | 149 | 150 | 150 |
| ASIC Revenue (US$mn) | 2,252 | 18,360 | 48,074 | 66,710 | 88,550 |
| Total TPU shipments | 0.5 | 4.1 | 4.6 | 5.1 | 6.0 |
EPS scenario into 2030 with TPUv10
| EPS scenario into 2030 with TPUv10 | 2026E | 2027E | 2028E | 2029E | 2030E |
|---|---|---|---|---|---|
| Gross Margins for TPU | 40% | 42% | 40% | x | 36% |
| Overall Gross Profits from TPU ($M) | 893 | 7,655 | 19,281 | x | 32,240 |
| Overall Corporate Gross Profits ($M) | 9,599 | 16,070 | 27,775 | x | 40,735 |
| Overall Corporate OPEX ($M) | 6,178 | 7,661 | 10,087 | x | 16,158 |
| Overall Corporate EPS (NT$) | 70 | 155 | 318 | x | 749 |
- Note: 2029-30 based on TPU v10 scenario, not JPM official forecast.
- Source: J.P. Morgan estimates.