2026-04-03_IC設計公司營收成長
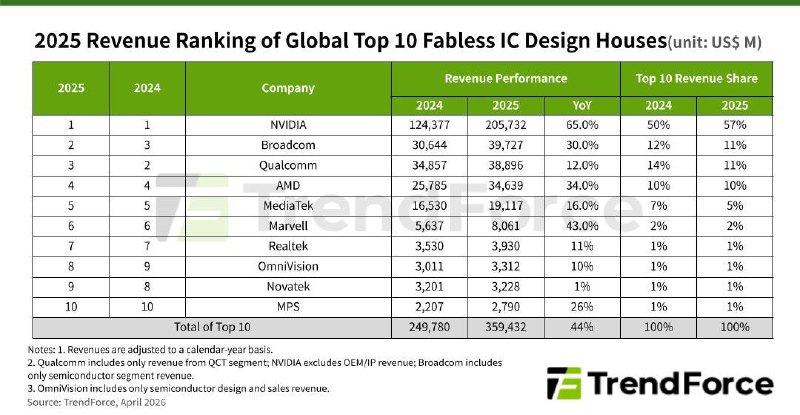
2025 年全球前十大無晶圓廠 IC 設計公司營收排名
☘️ Article
✍️ Abstract
營收排名表格
| 2025 | 2024 | Company | Revenue Performance (2024) | Revenue Performance (2025) | Revenue Performance (YoY) | Top 10 Revenue Share (2024) | Top 10 Revenue Share (2025) |
|---|---|---|---|---|---|---|---|
| 1 | 1 | NVIDIA | 124,377 | 205,732 | 65.0% | 50% | 57% |
| 2 | 3 | Broadcom | 30,644 | 39,727 | 30.0% | 12% | 11% |
| 3 | 2 | Qualcomm | 34,857 | 38,896 | 12.0% | 14% | 11% |
| 4 | 4 | AMD | 25,785 | 34,639 | 34.0% | 10% | 10% |
| 5 | 5 | MediaTek | 16,530 | 19,117 | 16.0% | 7% | 5% |
| 6 | 6 | Marvell | 5,637 | 8,061 | 43.0% | 2% | 2% |
| 7 | 7 | Realtek | 3,530 | 3,930 | 11% | 1% | 1% |
| 8 | 9 | OmniVision | 3,011 | 3,312 | 10% | 1% | 1% |
| 9 | 8 | Novatek | 3,201 | 3,228 | 1% | 1% | 1% |
| 10 | 10 | MPS | 2,207 | 2,790 | 26% | 1% | 1% |
| Total of Top 10 | 249,780 | 359,432 | 44% | 100% | 100% |
附註與來源
- Notes: 1. Revenues are adjusted to a calendar-year basis.
- Qualcomm includes only revenue from QCT segment; NVIDIA excludes OEM/IP revenue; Broadcom includes only semiconductor segment revenue.
- OmniVision includes only semiconductor design and sales revenue.
- Source: TrendForce, April 2026
- Logo: TrendForce